


Do ImageNet Classifiers Generalize to ImageNet ?
Outline
The Idea behind this paper is to check weather the ImageNet Classifiers classifies the image from another test set with same linearity or over the years training on ImageNet data has led to overfitting.
The interesting results from both CIFAR-10 and ImageNet dataset were; The model doesn't shows overfitting but shows a downward shift. In contrast to the ideal outcome, we find that a wide range of classification models fail to reach their original accuracy scores. The accuracy drops range from 3% to 15% on CIFAR-10 and 11% to 14% on ImageNet.
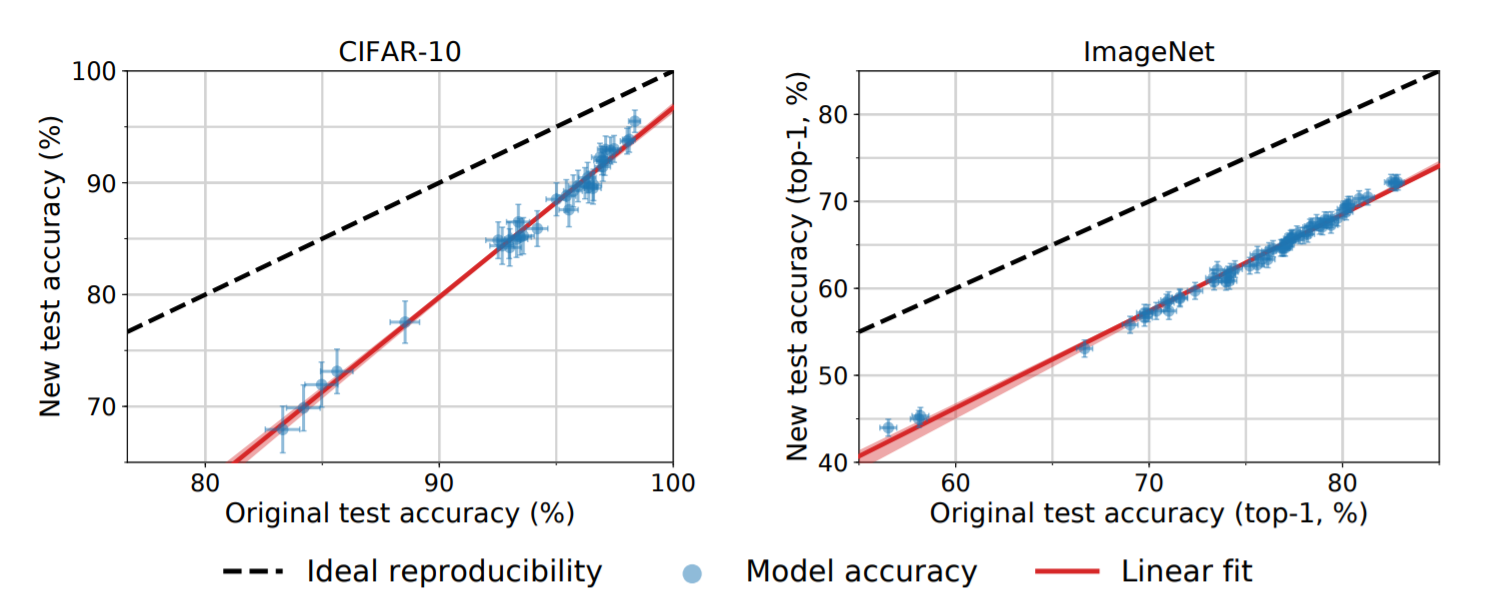
This shows that there are chances that models have adapted to the datasets via Hyperparameter tuning etc. but the relative order of the models is still the same for both datasets (The models which scores higher on original data also scores higher on new test data). The smaller improvement on accuracy of original set leads to larger improvement on new test set which shows extensive evaluation on test set is an effective method to improve image classification.
Causes of Drop in Accuracy
The authors of this paper proposed an equation which explains the cause of downshift on linearity by the model which shows the difference between test error on original set and test error on new dataset.
where,
Now According to this Adaptivity Gap is overfitting to the data but as the performance shows a linear line this might not be the case of drop, last one is Generalization Gap which shows the models ability to generalize to all kind on test set which was also eliminated as it doesn't contribute a lot on error difference (as for 95% confidence it contributed on 1% and for 99.99% it was only up to 2%).
So, now we are left which one which is Distribution Gap which is the variation due to change from original distribution to new distribution affects the model. This might occur due to the difference in design choices that weren't adopted with original dataset to new dataset.
Hypothesis
Since the drop from original to new accuracies is quite large, they proposed multiple hypotheses for explaining this drop. However, none of these effects can explain the size of the drop.
- As above shown Generalization Gap does not contribute much in the drop Statistical Error can be ruled out as a major explanation.
- Differences in Near-Duplicate Removal can only explain at most 1% of the difference
- Hyperparameter Tuning doesn't improves on accuracy to new test set
- Visually Inspecting Hard Images shows all the new images are valid images that are recognizable to humans.
- Human Accuracy Comparison explained that on average humans do not see a drop in accuracy on this subset of images.
- There is no large distribution shift between the new test set and the original CIFAR-10 dataset, or that the model is unable to learn the modified distribution.
- Cross-validation, the variation among the cross-validation splits is significantly smaller than the drop on our new test set.
- Model were not able to discriminate between original and new datasets (aka Discriminator Accuracy)
- Imbalanced amount of data in Test Set for each class
The other insights we get from the paper is that on applying some of sampling strategies we can obtain slight variation in the accuracies.
- Matched Frequency: The selection frequency distribution for each class from the annotated original validation images
- Threshold 0.7: For each class, they sampled ten images with selection frequency at least 0.7.
- Top Images: For each class, we chose the ten images with highest selection frequency
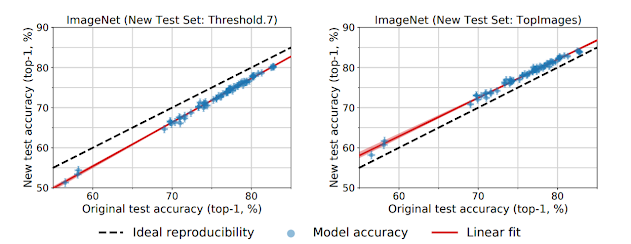
Though tuning the parameters gives a shift in accuracy but still this could not explain the linear relationship between the accuracies.
Linear Model
Assuming that every example i has a scalar “difficulty” τi ∈ R that quantifies how easy it is to classify. Further assuming the probability of a model j correctly classifying an image with difficulty τ is given by an increasing function ζj (τ ).
Models with higher skill have higher classification accuracy, and images with higher difficulty lead to smaller classification accuracy
Considering the case where we have multiple models and two test sets with difficulty parameters µk and σk respectively for k ∈ {1, 2}. Then α˜j,2, the probit-scaled accuracy on the second test set, is a linear function of the accuracy on the first test set, α˜j,1:
Although this doesn't gives conclusive evidence of linearity but shows some of clues of it.